Debug your Angular app in Webstorm
03 November 2017
Introduction
A few weeks ago, I tried to setup the Webstorm debugger in my Angular project and I failed miserably. I cannot understand where it went wrong. Today, I had a very rebellious bug to track so I tried again and guess what, it went smoothly.
This short blog post describes the steps I took to set it up (in order to remember it later and just in case it helps somebody else).
It is based on the official documentation on Jetbrains website : Debugging TypeScript and a short blog post from Jetbrains Debugging Angular apps created with Angular CLI in WebStorm
Note that I am running Webstorm 2017.2.5
Prepare the environment and the project
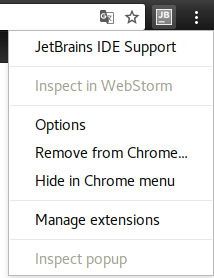
First you need to install the chrome JetBrains IDE Support extension
Once it is done, you should see the extension icon next to your browser navigation bar.
We will now init a new Angular project using the CLI and Webstorm. In Webstorm, click on File then New Project.

As you can see in the path of my node and ng executables, I am using the node version manager project. I encourage you to look it up. It is a very handy tool to manage different node versions on your system : nvm.
On the left side, choose Angular CLI then on the right side, select an installation folder, your node executable and your @angular/cli installation folder. Then click on Create. Wait for it to finish the installation of your new Angular project.
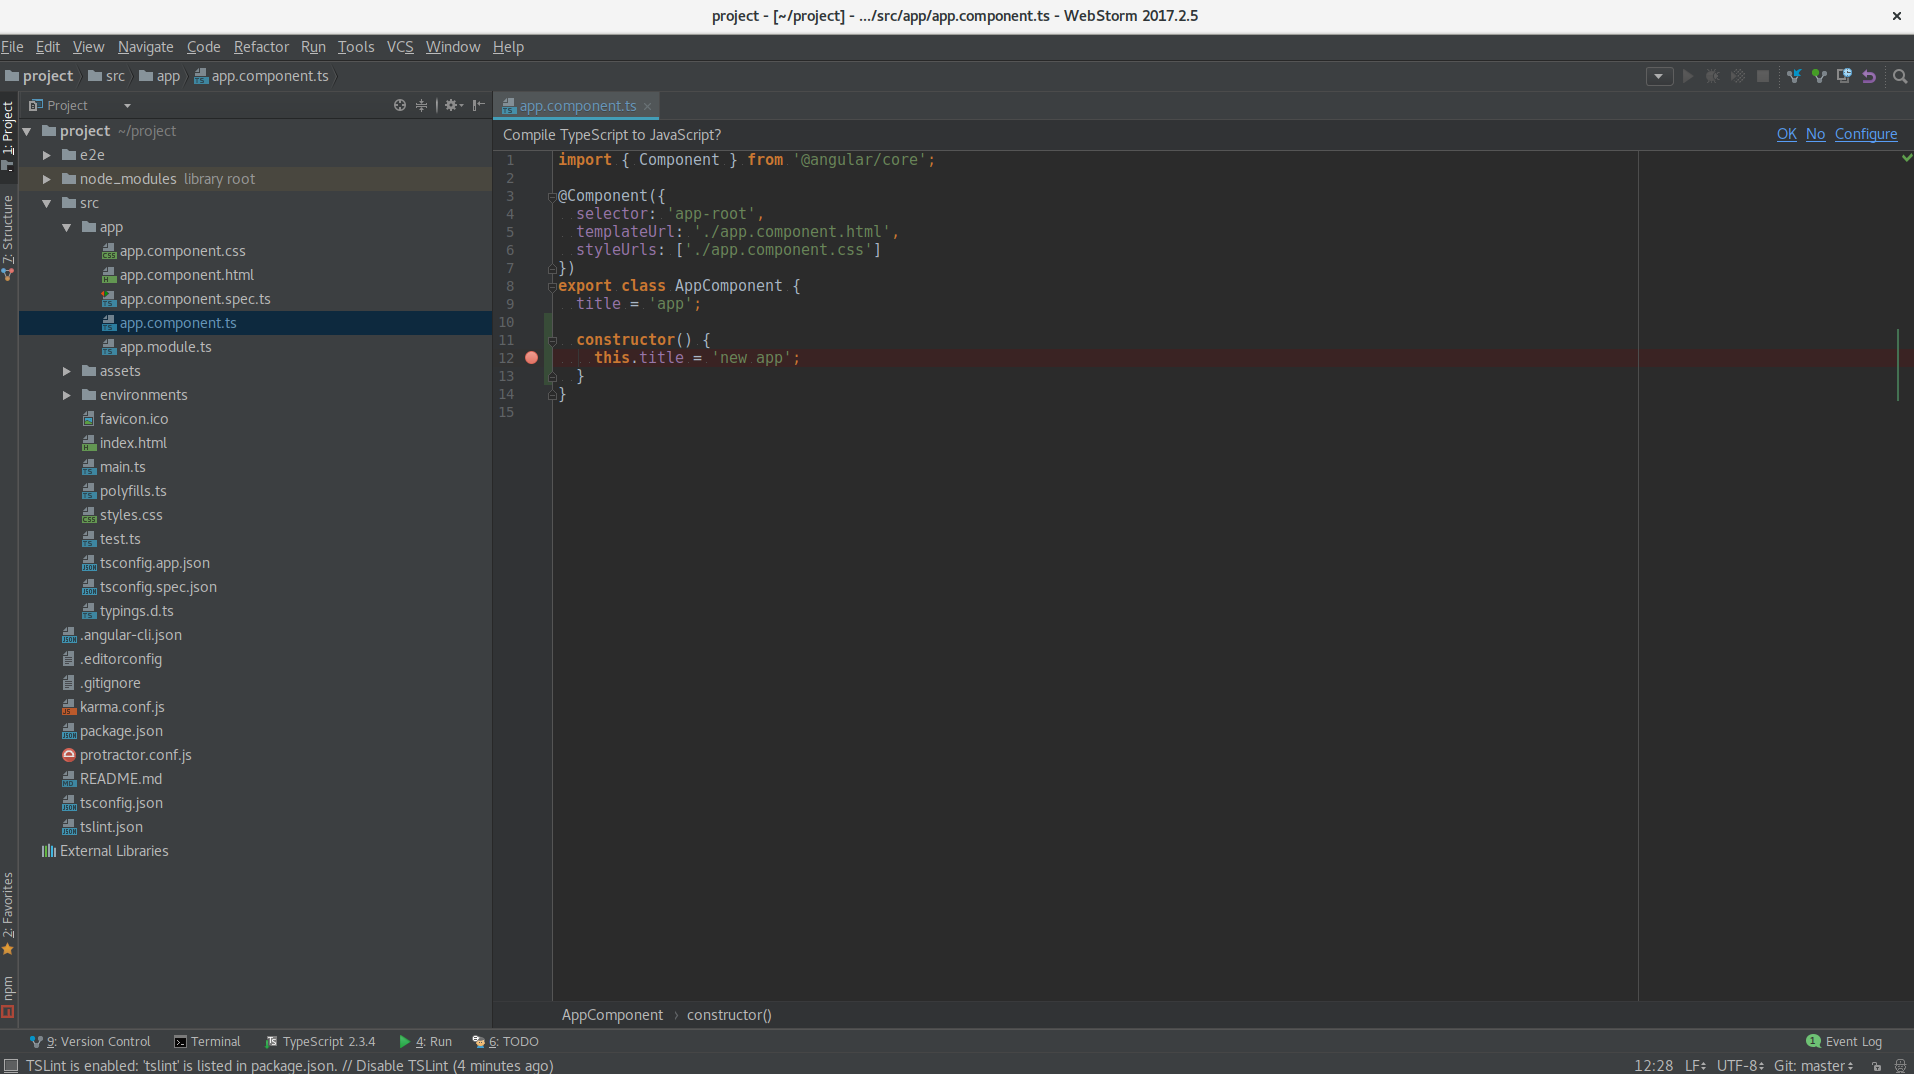
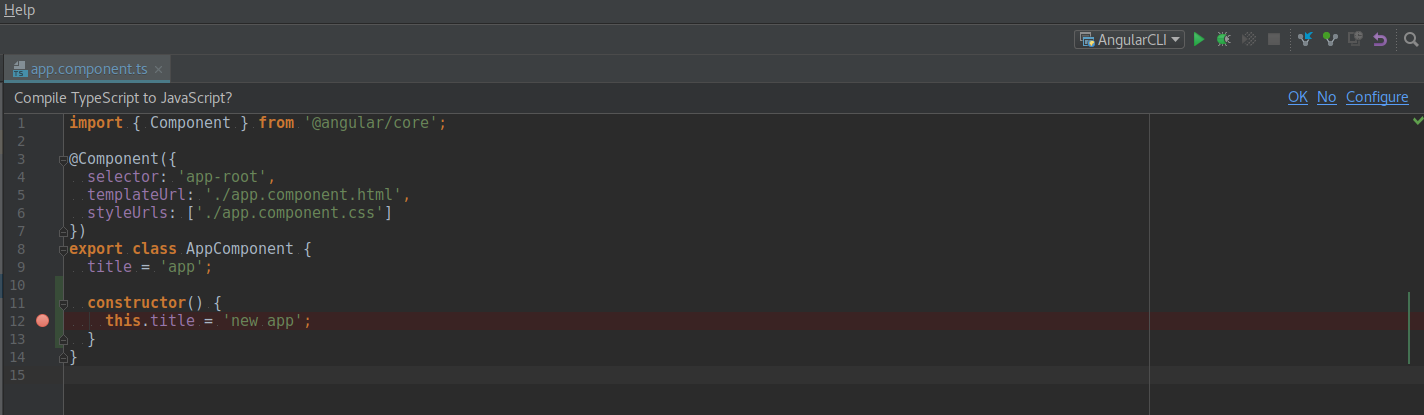
For testing purpose, I am editing the generated AppComponent to add a constructor in order to update the title attribute value and put a breakpoint on this new line :
Then start the development server, for exemple, run ng serve in webstorm terminal window (or you can configure a run configuration).
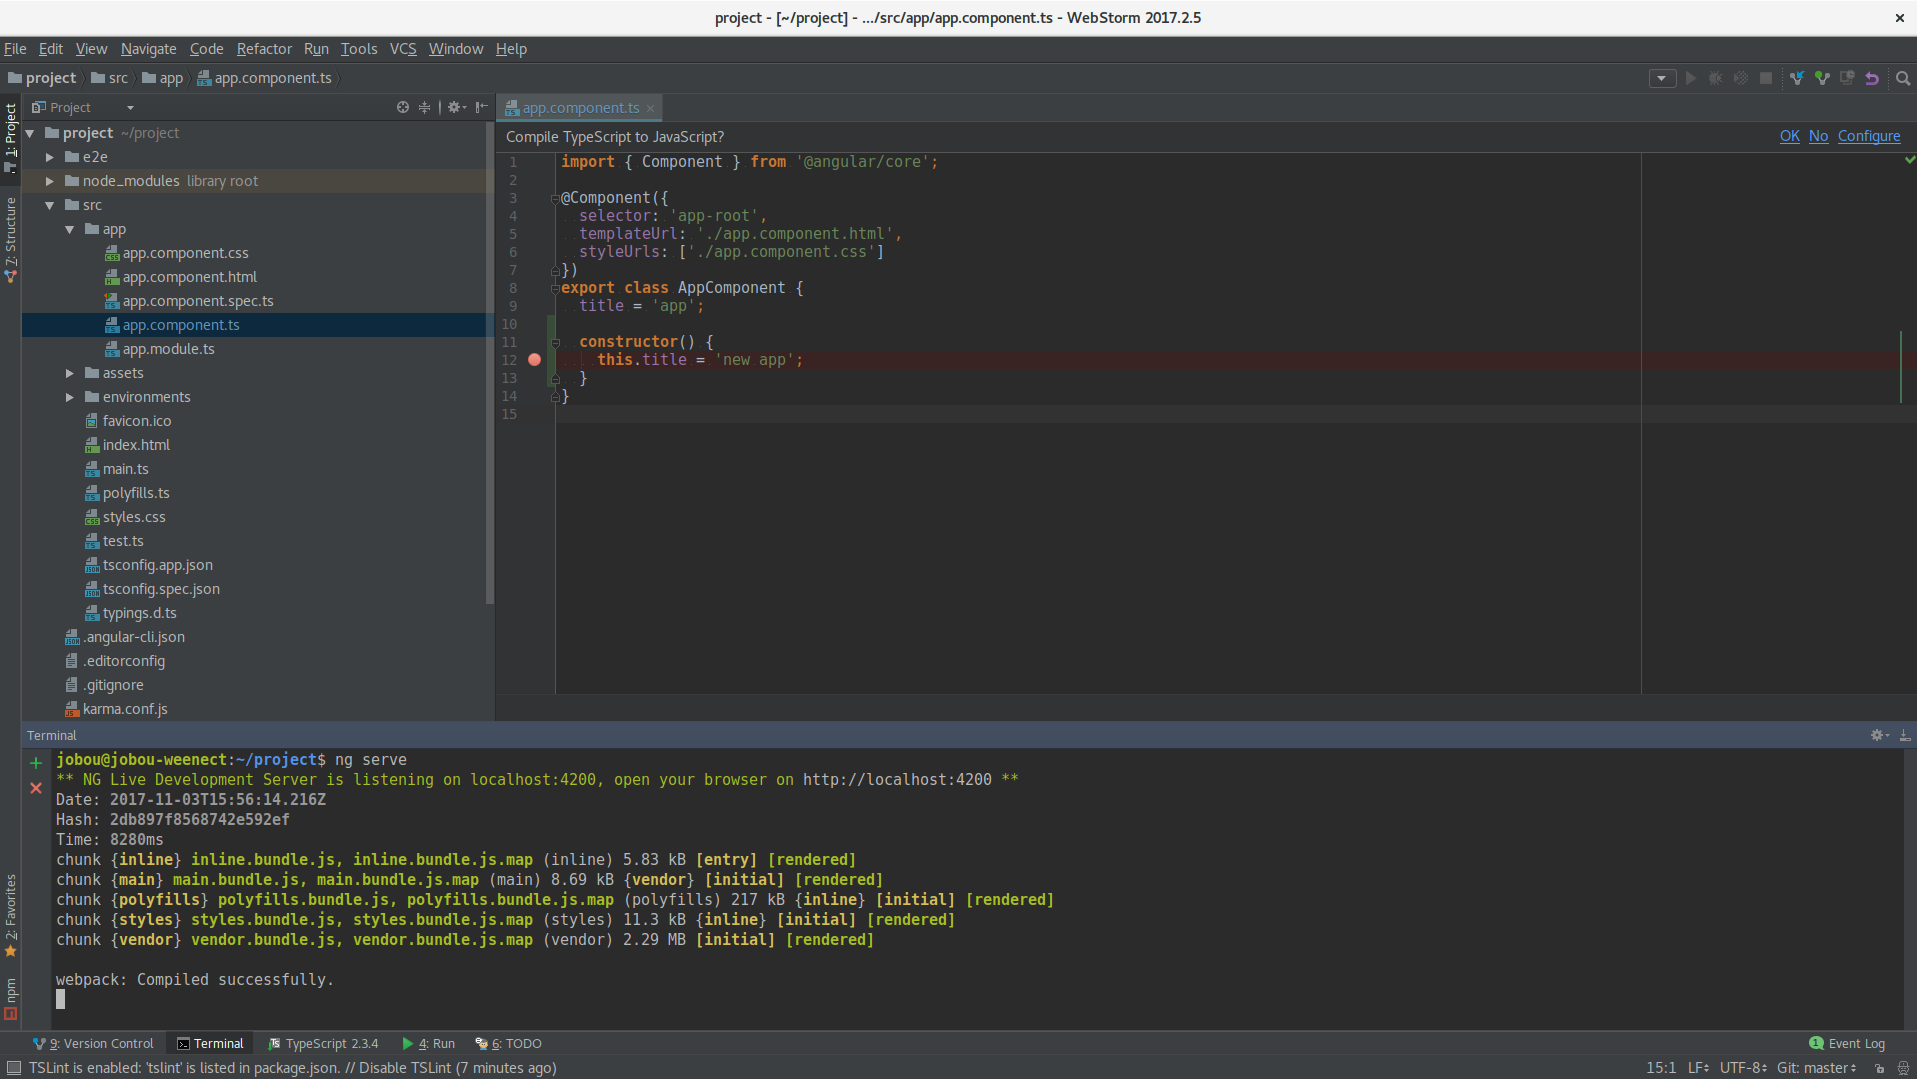
The CLI output the URL your development server listens to. Most probably : http://localhost:4200.
Debug your code
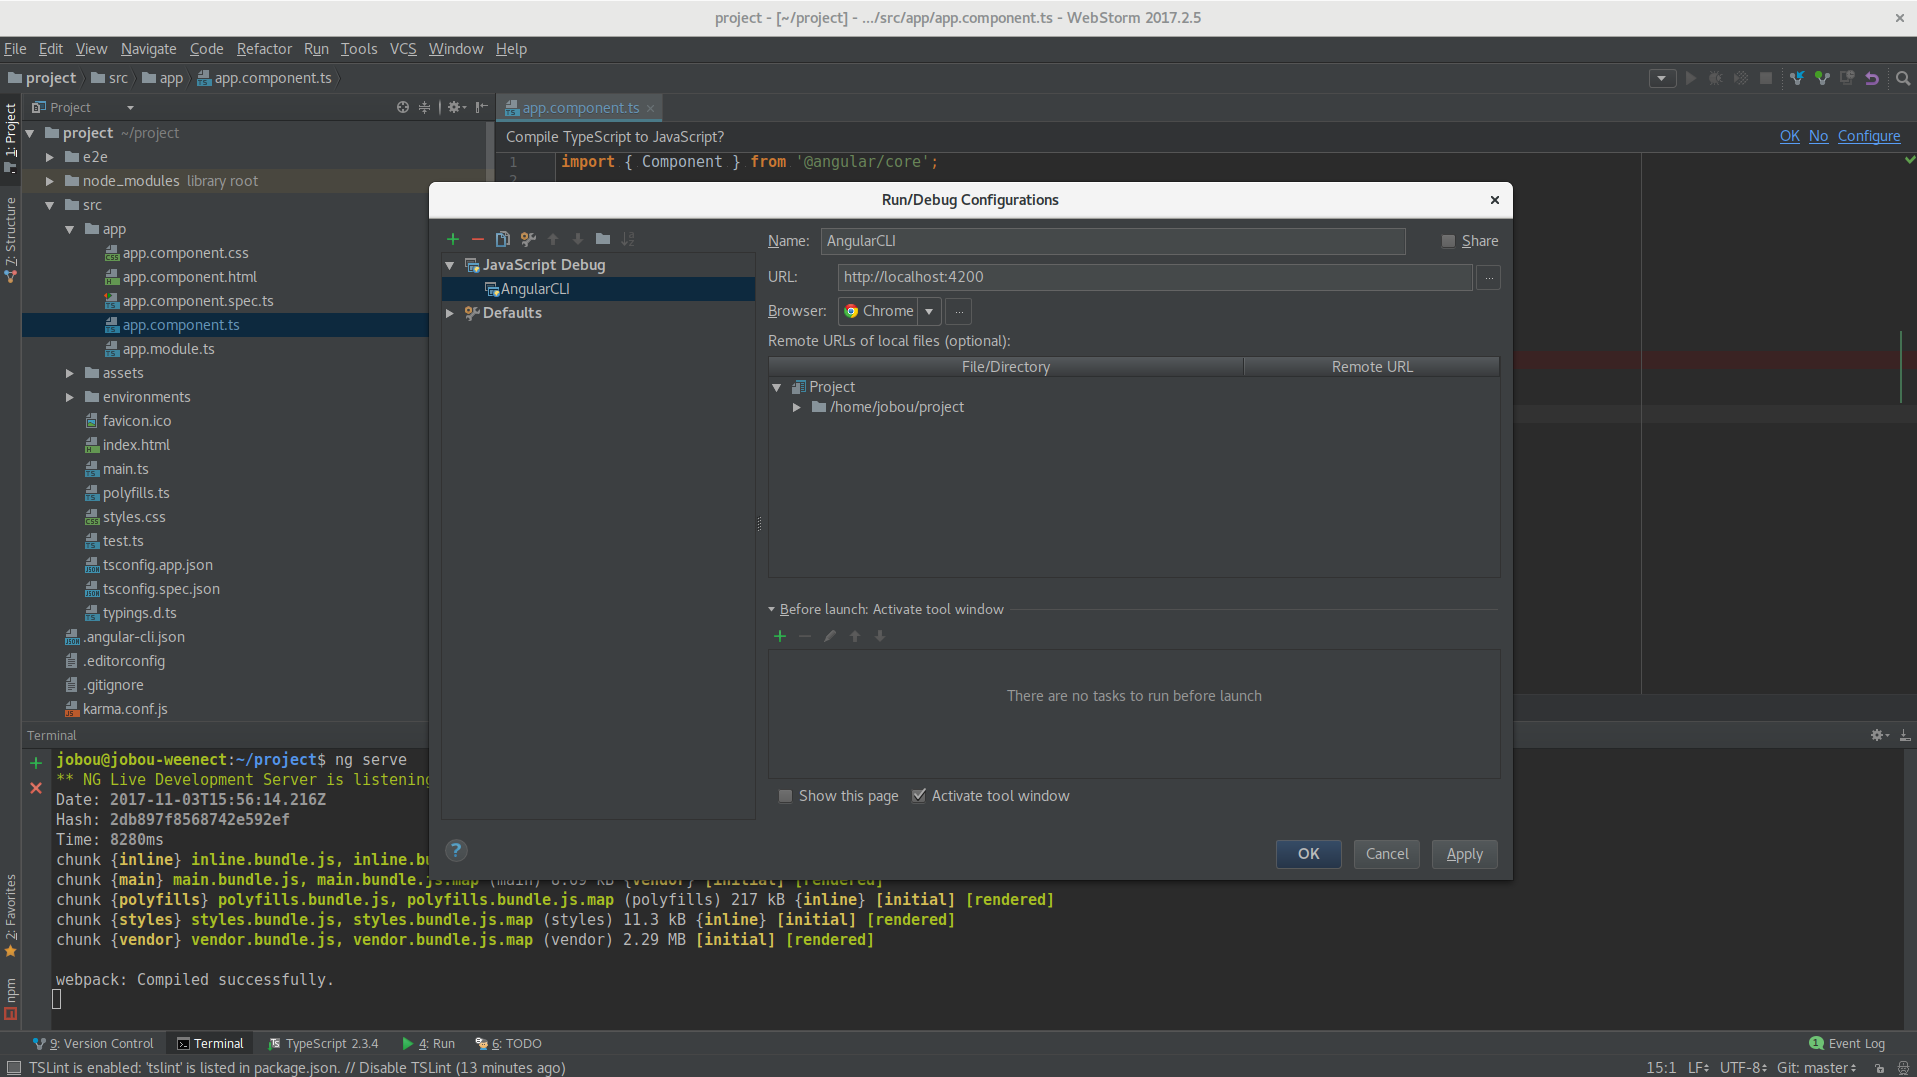
Start with the creation of your debug configuration profile in Webstorm. This is a one time step only. Click on Run > Edit configurations.
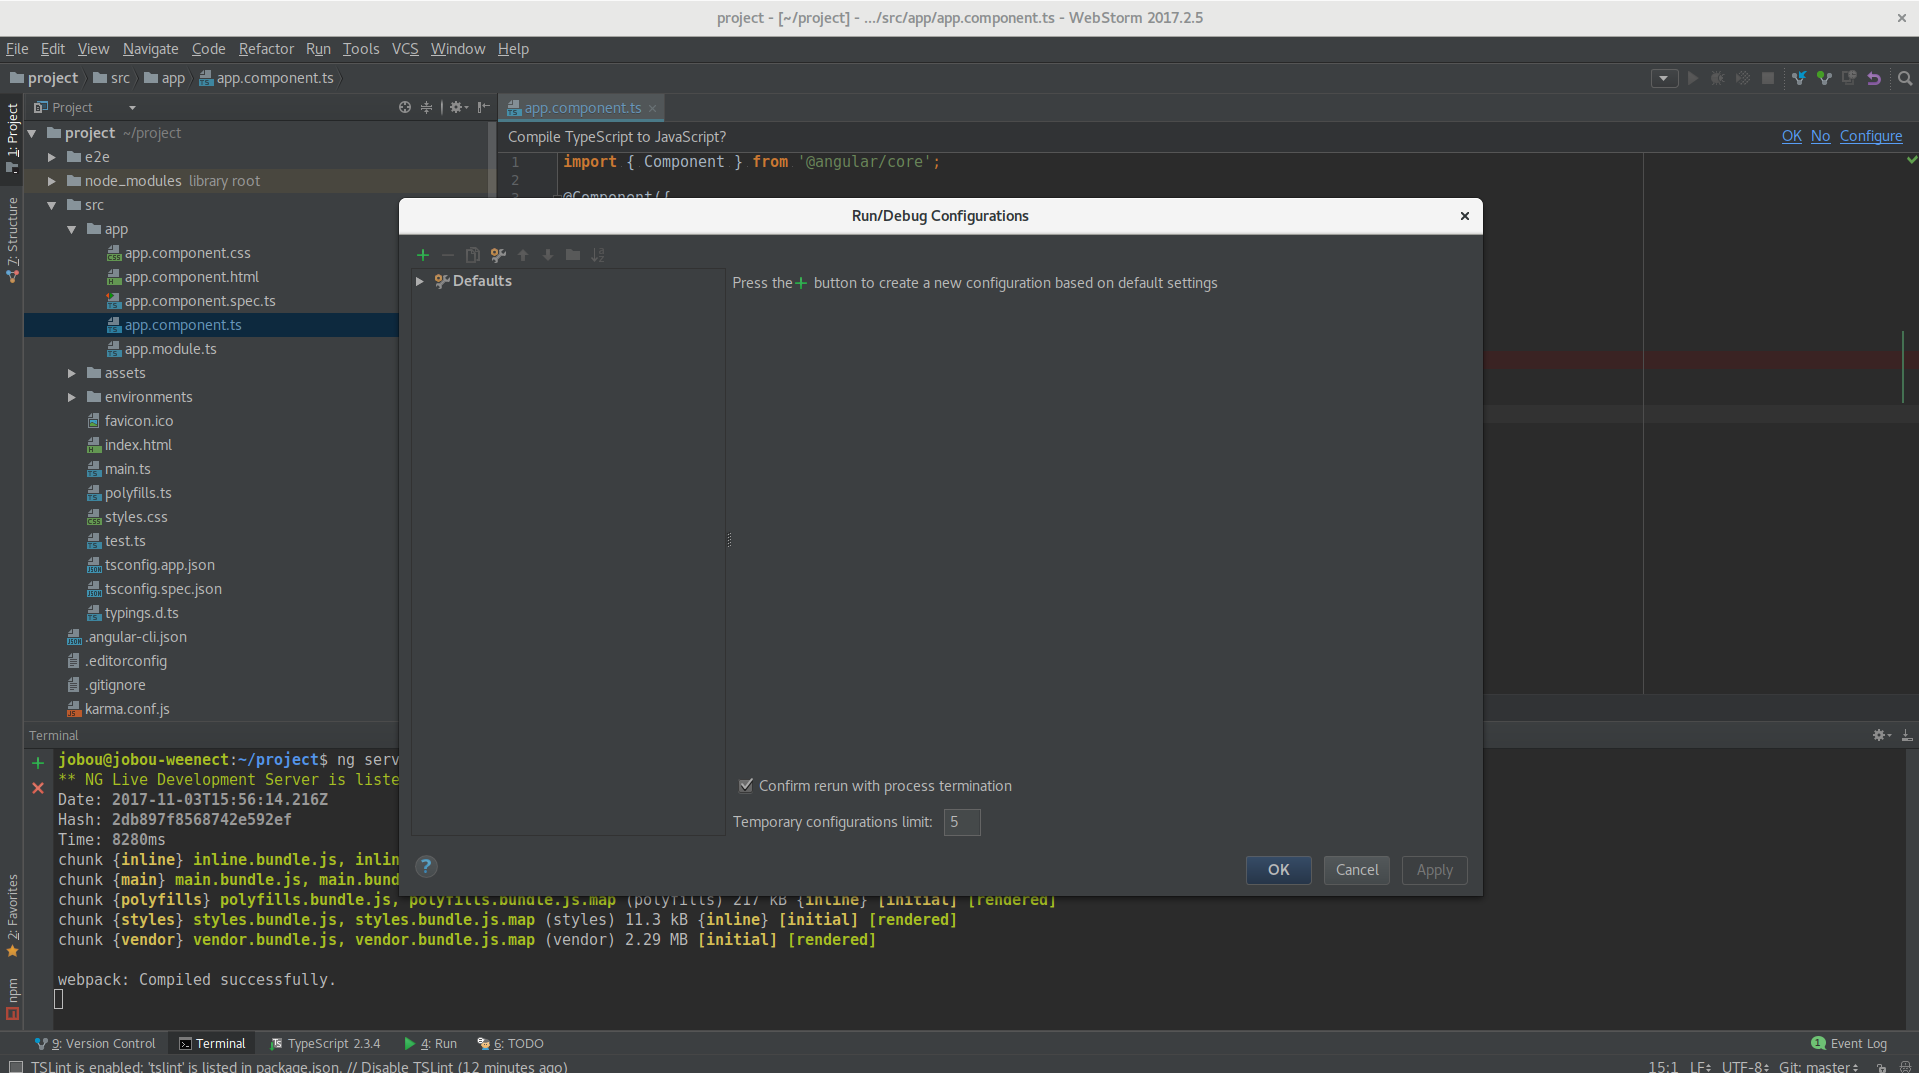
Then click on the little green cross icon on the top left corner and select Javascript Debug. There, you can :
- give a name to your configuration :
Angular CLI - paste the URL of your development server :
http://localhost:4200 - save your configuration by clicking on
OK
That’s it. You are now ready to debug your code step by step with breakpoint and other cool features provided by your IDE.
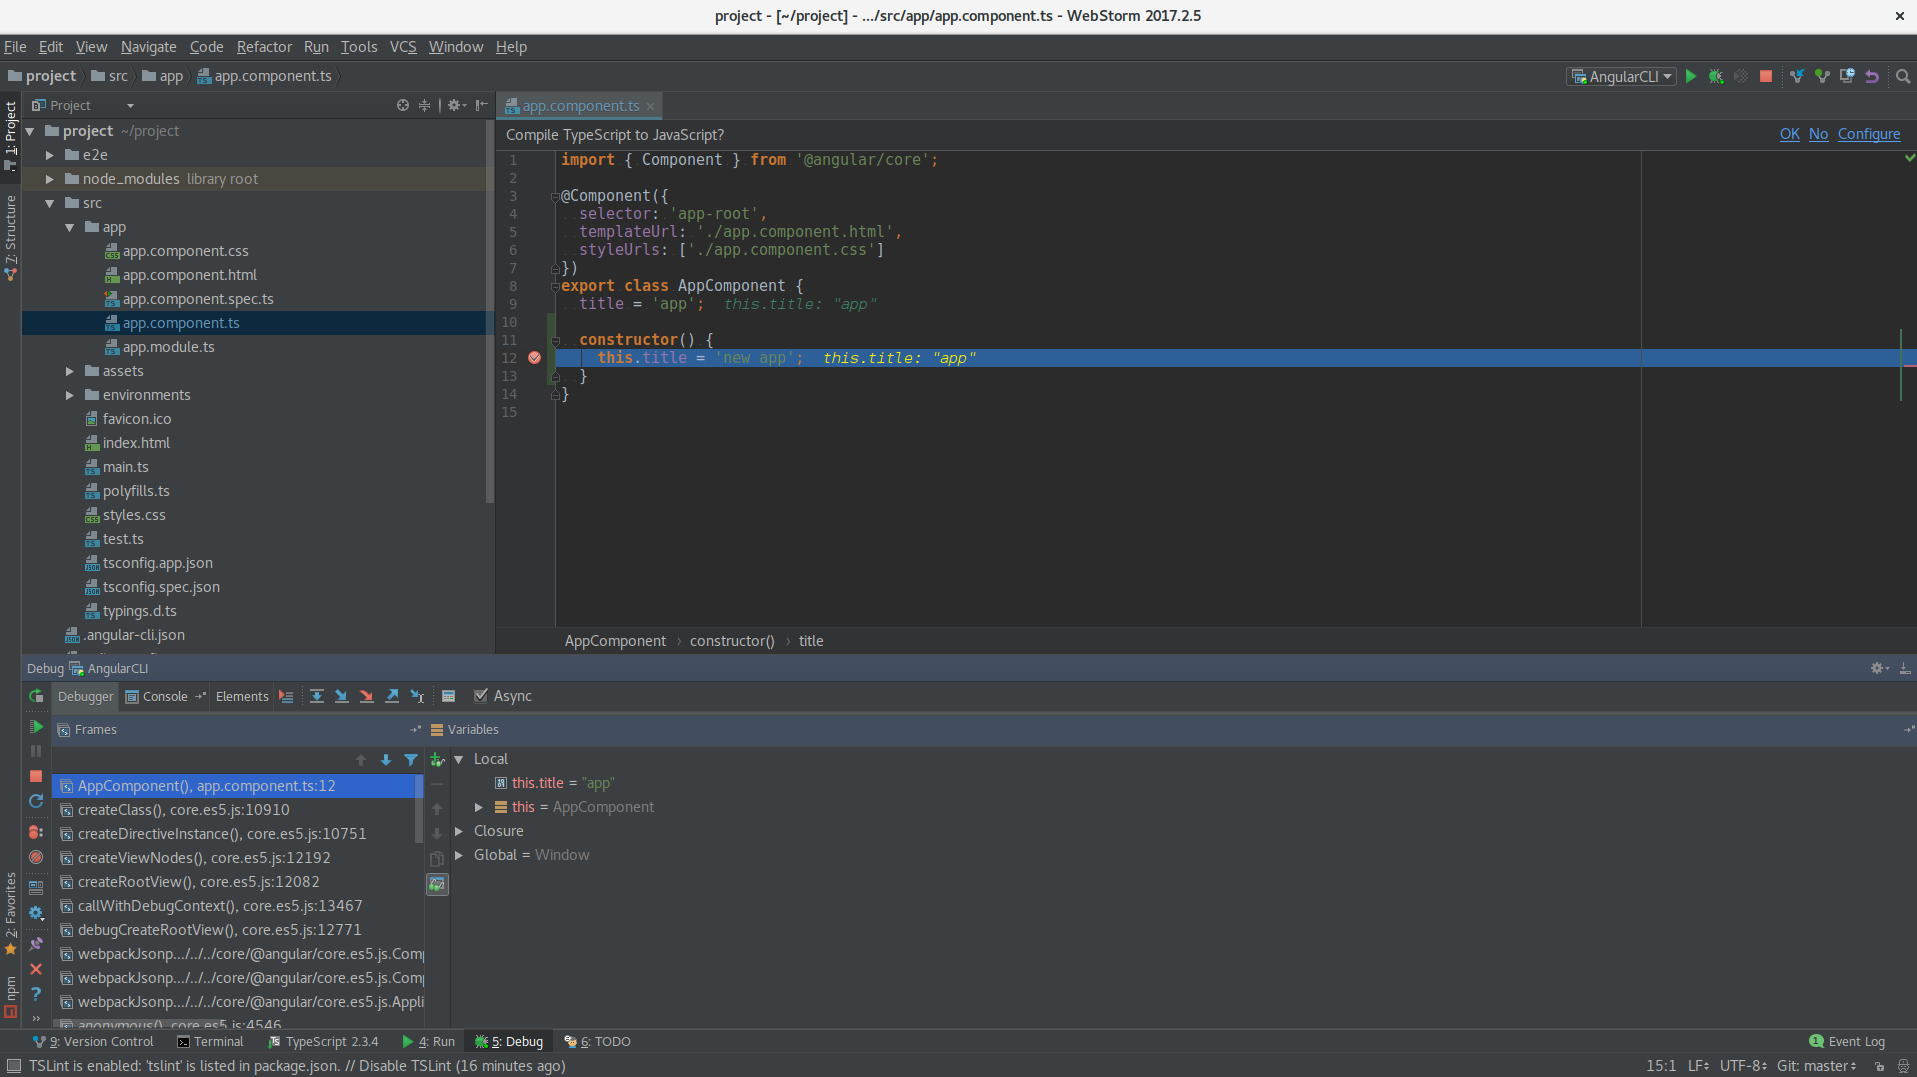
Run your debug configuration by clicking on the little green bug icon above your editing view. Be sure that you have selected the configuration we have just created in the drop down menu next to it.
Webstorm should open a new browser window to http://localhost:4200 automatically and in the debug view, it should reach and stop at your breakpoint.
Happy debugging !!!!
Troubleshooting
When I first tried to debug my project and failed, I had many instances of Webstorm running on my computer with one other PhpStorm and many other PyCharm. I am now wondering if my issue was not related to a wrong extension port between my Webstorm instance and the chrome extension. Just in case, I am putting this link as a reference to the official documentation if you have any issue of this type : Changing the default port for connecting to WebStorm